
Pedalling into prosperity: the economics of cycling
_
”Whenever I see an adult on a bicycle,” said H.G. Wells, “I have hope for the human race.”
He was a fervent fan of two-wheeled travel, Herbert George, and in his writings imagined that cycle tracks would actually be the dominant transport infrastructure in a future Utopia, merrily criss-crossing his imagined paradise.
And his Utopia would, by the way, also feature free-thinking citizens, an end to racism and the elimination of the nationalism that leads to war.
If he’d hurled into the mix some community-owned renewables, ethical micro-finance, a cheeky bit of urban gardening and a serious push on sustainable food then I’m pretty certain he’d have painted a picture of Platform’s perfect future Mancunia.
Two wheels good though, that was Wells’ take on sustainable urbanism and it’s a track Greater Manchester is headed down courtesy of fresh funding and emboldened civic plans and partnerships. In the following article I plan to set out our targets and then run through the ways in which a generational investment in cycling can repay a city’s coffers many times over.
What’s in the plan?
Greater Manchester’s Vélocity 2025 programme, building on earlier waves of investment such as the Local Sustainable Transport Fund (LSTF), has set a target of a 300% increase in levels of cycling by 2025. Supported by significant Government funding - initially for two years - and partners like Sustrans, British Cycling, CTC and Love Your Bike, the city region has set its sights on a future where the proportion of local journeys by bicycle increases to 10% over the next decade.
The programme’s key investment is an integrated and strategically planned network of dedicated, high-quality, newly built or enhanced cycling routes that will be segregated from other traffic wherever possible, connecting homes, schools, workplaces and leisure destinations.
All this, underpinned by training and promotional programmes, cycle hubs for commuters and a programme to support businesses to pull together green travel plans for their workforce.
You could argue that we’re working with the grain of current modal fashion; that more people are choosing cycle chic over passé petrol, regardless of the actions of transport planners and city leaders. You could argue that becoming a ‘cycling city’ in 2014 isn't as radical as it might have been a few years ago.
This is partially true, and to over-claim any recent lifts in cycling whilst our infrastructure has remained well below the standards enjoyed in other cities would be foolish; but it’s fair to say that we’ve turned a corner; there are targets set and they have unlocked investment: we are definitely headed in the right direction.
Consultations are ongoing over the specifics of routes and standards of the design solutions being proposed, and we should see those new ‘dutch-style’ cycleways coming online before too long.
Keeping up the pressure
Of course this doesn’t mean that those campaigning for cycling have any reason to relent, rest and reflect on their successes, though. The threat for any city that still suffers from areas of congestion and a predominant ‘car culture’ is that this push to revolutionise how we get in, out and around our city could still falter if the case-making for change isn’t relentless and based on the firmest of evidence.
Auto obsession still is a stubborn cultural hegenomy, in our city and across the nation.
That’s because auto obsession still is a stubborn cultural hegenomy, in our city and across the nation. If you use Twitter for example to take a measure of the zeitgeist, you can’t get past the fact that in the last 30 days there were 80,000 tweets with ‘new bike’ in their 140 characters compared to 500,000 that talked of a ‘new car’. New developments across Greater Manchester – around our academic campuses for example – still see heated debate around how much free or subsidised parking there will be for those who sadly can’t imagine any other way to travel than in their own trump-filled tin box; and if a key development site stalls in our great city, a ‘ghost car park’ inevitably pops up where a much softer and less damaging ‘meanwhile’ use of land would do so much more for Manchester.
It’s clear that the cultural ‘velorution’ is not yet complete and as Greater Manchester prepares to make further investments in its cycling infrastructure and aims to ‘double and double again’ the number of trips taken by bike, it’s critical that the social and economic returns of its investment programmes are beamed into the brains of decision makers and etched onto our collective eyelids, to stiffen resolve, particularly in preparation for an almost inevitable petrol head backlash and the ever-present danger of slipping back to ‘business-as-usual’.
Keeping our ‘eyes on the prize’ of increased cycling and the benefits it can deliver will also help all those involved continue to aim for the true ‘Dutch-style’ design solutions we seek to build as, inevitably, the process of delivery starts to whittle away at our Vélocity 2025 aspirations.
Our city leaders are signed up and we’ve won some central Government investment, but the tin of green paint and the easy-to-invade green advanced stop box are the options that it would be all too easy to default to.
Why invest in cycling?
The level of return on investment for cycling stands well ahead of other transport modes (yes, including Metrolink) and in stark contrast to provision for cars, where there is a clear, negative impact on the wider economy.
The first tranche of benefits that fit most closely with Greater Manchester’s strategic priorities are reduced healthcare costs and a ‘bounce back’ as business sees fewer days off sick; increased physical activity and more widely a reduction in air pollution will cut both cardiovascular and respiratory problems leading to fewer hospitalisations and a better record when it comes to sick days.
Our plan is to become ‘denser’ in urban terms, and as a result we need to get more workers, visitors and citizens in and out of our town and city centres without relying on private cars.
Next there’s an economic boost broadly aligned with our strategic transport infrastructure and its ongoing reinvention as we grow as a city. Our plan is to become ‘denser’ in urban terms, and as a result we need to get more workers, visitors and citizens in and out of our town and city centres without relying on private cars. Google the ‘economies of agglomeration’: bikes can help to deliver this.
Increased levels of cycling mean less money spent on road construction, repair and maintenance costs; less will need to be invested in parking spaces and the subsidies that go with them, and more widely we’ll see a business benefit through reduced congestion and a societal benefit as road safety levels improve.
Then there’s the bicycle economy itself. You can track economic benefits from bicycle tourism, sales and manufacturing, training, promotion and the work of actually creating cycling infrastructure which, as will be outlined below, can boast a much more impressive multiplier effect than most other types of infrastructure development.
There are a clutch of ‘knock on’ impacts which should also be factored into our economic rationale for investing £10m per year in our ambitions to become a cycle city, an investment level, incidentally, which seemed bold just last year but which has already been bettered by at least one major regional city.
There are proven benefits for local retail centres as cyclists show themselves to shop more readily and more frequently than those who move mostly by car.
We can account for reduced carbon emissions, which have a ‘soft’ market value but a direct cost if we invest in other policy mechanisms to hit our 48% carbon reduction target for the city region. There will be reduced costs in measures to deal with the air, water and noise pollution created through unchecked use of private cars. There are proven benefits for local retail centres as cyclists show themselves to shop more readily and more frequently than those who move mostly by car.
And then finally there’s the residents and workers of Greater Manchester who can make the great bicycle transition happen. Individual households that switch from four wheels to two for many of their utility or commuting trips can see a tangible and positive impact on their household budgets as they spend less on fuel, repair and maintenance costs; a final two-wheeler dividend unlocking more money to spend in the local economy, and completing the cycle of economic benefits that bikes can bring.
These myriad benefits returned on a very modest investment compared to other forms of transport infrastructure, can be proven (as seen below) and, if understood, should be factored into our calculations on the city transport systems we want to deliver in the future and maximised to boost the return that they offer.
If we make a firmer and more accurate account for cycling we’ll find it is possibly the most effect investment we could wish to make in our civic future.
An early recommendation should be that Greater Manchester should not only prepare a ‘cycle city account’ of the benefits of cycling (one is actually being drawn up with Sustrans) but that it should also compare these benefits to the other investments we’re making, and if cycling is outperforming other modes, we should seek to invest to an even greater level.
Sick notes and sticky arteries? Get peddling.
As America’s ‘Science Guy’ Bill Nye once put it, there really is “something wrong with a society that drives a car to work out in a gym.”
What transport planners would call ‘active travel’ (in other words cycling, walking or a jolly jaunt on a space hopper), brings a dramatic and immediate health dividend. The ‘active’ bit delivers a much needed activity boost for a society like ours where one in four adults are considered to be obese; at the same time the ‘travel’ bit, being greener because it’s walking or cycling, reduces air pollution and the health problems associated with that.
There’s plenty of solid evidence in this area. Walking or cycling to work has been shown to make a big difference in health outcomes, particularly amongst women; one recent study showed that regular active commuting led to an overall 11% reduction in the risk of cardiovascular disease in the UK. [1]
A similar finding was uncovered at two NHS acute hospitals in London and Nottingham where environmentally-minded workplace health projects reshaped individual behaviours and the physical environment in parallel. A similar drop in heart disease risk of 11% was shown amongst those who chose to cycle or walk to work, supported by measures like decent cycle storage or workplace promotional campaigns with health and fitness advice sessions and screening. [2]
To get a handle on the possible savings through health impacts, Cycling England commissioned a report in 2007 that looked at the metrics in more depth. Based on a modest three trips per week of just less than 4km, the average new cyclist could be seen to be unlocking health benefits of £160 in terms of savings to the NHS, productivity savings (for example from less time at work lost to illness), and fewer deaths through poor health. [3]
Elsewhere in the world, similar calculations are being made. In Australia the Commonwealth Department of Health and Ageing calculated the economic benefits of cycling in 2008 to the health system at $227 million each year. [4] Earlier in 2006 the Australian Sports Commission valued recreational cycling (as opposed to commuting) as being worth $82.9 million once again with the three times per week frequency required to gain significant health benefits. The same study also suggested that cyclists also were saving the economy $63.9 million per year in reduced congestion costs. [5]
Less risk, less pollution and greater levels of fitness; it’s a mix that has been show to reap benefits time and again.
Less risk, less pollution and greater levels of fitness; it’s a mix that has been show to reap benefits time and again. In neighbouring New Zealand an estimate was made of the impact of a 5% shift in journeys to cycling away from private vehicles. Each year it was estimated that the health effects would include about 116 deaths avoided through increased physical activity, six fewer deaths due to reduced local air pollution and an additional five fewer cyclist fatalities from road crashes. In economic terms these health effects would represent net savings of about $200 million per year. [6]
More ambitiously a study in the United States estimated the savings through physical fitness and better health across Wisconsin if an impressive 50% of short trips were taken by bike; here the researchers foresaw savings of approximately US$3.8 billion per year from avoided mortality and reduced health care costs and if improved air quality and physical fitness were included in the scope, the total savings would exceed $8 billion per year. [7]
Our city has been labelled ‘the heart disease capital of Britain’ and in a 2013 survey our residents were shown to be three times more likely to die early than those in Kensington and Chelsea
Greater Manchester has a uniquely compelling reason to embrace active travel, given the evidence above. Our city has been labelled ‘the heart disease capital of Britain’ and in a 2013 survey our residents were shown to be three times more likely to die early than those in Kensington and Chelsea; it’s clear from the evidence above that a substantial uplift in cycling levels will pay for itself across the city region in health improvements alone.
Workers of the world unite, and cycle!
While health services can see a positive impact if more people choose to cycle, the fact that cycle commuters also take fewer sick days has also been tracked by a number of studies and added to the tally of economic impacts.
In one recent study the employees of three large Dutch organisations completed a web-based questionnaire on cycling to work in relation to health and work performance. The employees who completed the study were tracked for absenteeism and the results analysed. Of the 1,236 employees studied, 64% were regular cyclists and 36% were non-cyclists. Regular cyclists had significantly lower rates of absenteeism (on average 7.4 days per year) than non-cyclists (on average 8.7 days per year). There was also a relationship between cycling distance and frequency: the more often one cycled and the longer the distance travelled, the lower the rate of absenteeism.
If the economic impact of this were mapped against the UK economy for every 1% increase in cycling reported, the economy will see a £95million benefit in terms of fewer sick days.
At its most simple the study shows that cyclists take just over one day less a year off for sickness. If the economic impact of this were mapped against the UK economy for every 1% increase in cycling reported, the economy will see a £95million benefit in terms of fewer sick days.
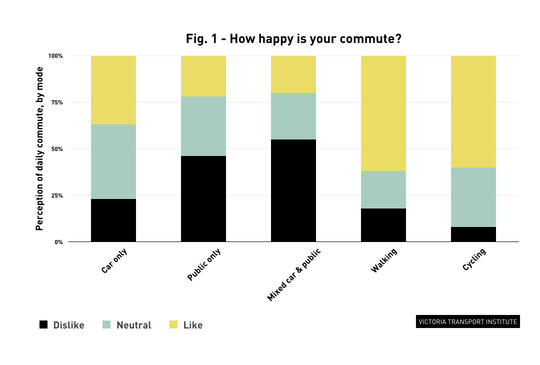
There’s a chance your employees also get to work happier if they can walk or cycle. The chart below, taken from the work of the Victoria Transport Institute is a summary of a study into the relative satisfaction, by mode, of Canadian commuters when asked whether they liked or disliked their commute. Of all modes, only a fraction of cyclists or walkers say they dislike the way they get to work in the morning.
In another study, this time from Sweden, the happiness and wellbeing of ‘active commuters’ was assessed against car users and those on public transport. Compared with those who walk or cycle, car commuters were found to be more likely to report poorer sleeping quality, everyday stress and have an elevated level of sickness absence. Public transport users didn’t report more sick days but they too felt more stress and poorer sleep quality than active commuters. [8]
Building cities for cyclists
One of the most striking visual depictions of transport mode choice and the impact it can have on a city is to stage a photocall in a downtown location and show the commuter flow that’s possible with single-occupancy car drivers versus cyclists or walkers. In terms of raw volumes, a car takes up the street space that can carry nine cyclists or an even more impressive 24 walkers: as a use of valuable city space, the bicycle makes good sense.
Studies across the world report a positive economic multiplier effect when cities invest in and embrace cycling.
Studies across the world report a positive economic multiplier effect when cities invest in and embrace cycling. One study focused on Portland, Oregon, where businesses have a culture that accepts the bicycle mode, sometimes offering specials for those who arrive by bike, plus amenities such as lockers, showers, and other services that are less obvious from the street. Portland is actively pursuing this development concept, but the individual elements of bike-supported development are catching on nationwide, even when support from the business community is mixed.[9]
Some cities are preparing ‘cycling accounts’ to show the overall impact of investment. The often cited City of Copenhagen methodology suggests that: ‘When a person chooses to cycle this is a clear gain for society of DKK 1.22 (13 pence) per cycled kilometre. Conversely, society suffers a net loss of DKK 0.69 (8 pence) per kilometre driven by car.’
The people currently cycling to work across Greater Manchester already deliver a £7.8 million benefit every year.
According to the 2011 Census, 25,769 people cycle to work in Greater Manchester each day. If these people only cycle 5km (3miles) each way to work (5 days a week) then collectively they will cycle 60,557,000 kilometres per year. [10] Using the Copenhagen cycling benefit figure (13p/km) the people currently cycling to work across Greater Manchester already deliver a £7.8 million benefit every year.
Greater Manchester’s Vélocity 2025 programme aims to doubling and doubling again the number of people cycling to work. This would see the number of people cycling to work in the order of 100,000 per day. Or an additional 75,000 people cycling to work. Using the same assumptions of distance etc. above would see an 176,250,000 kilometres being cycled per year. [11] With the Copenhagen 13p/km figure this would deliver a £22.9 million benefit to Greater Manchester every year.
One review set the cost benefit ratio of the economic benefits of cycling interventions, including health impacts from more physical activity, at 5:1
Building a city for walkers or cyclists makes for a good investment all round. One review set the cost benefit ratio of the economic benefits of cycling interventions, including health impacts from more physical activity, at 5:1. [12]
Another 2010 study of infrastructure which enables increased activity levels amongst local communities through cycling and walking set a value to the NHS in terms of cost savings, and for transport as a whole as being even higher. The median global return was 13:1 while for the UK alone it was even higher, at 19:1 in terms of a return on investment.
On the scale of city design and planning, recognising the investment return of cycling is critical if we are to move cycling into the mainstream of modal choice. For far too long cycling has been seen by many as a ‘nice to have’ bit of green tokenism, probably because the last time they cycled was when they wore short pants and belonged to the Tufty Club, but also because they have absolutely no awareness whatsoever of cycling’s economic dividend. As a result across the world cities and nations are starting to move towards putting a value on cycling.
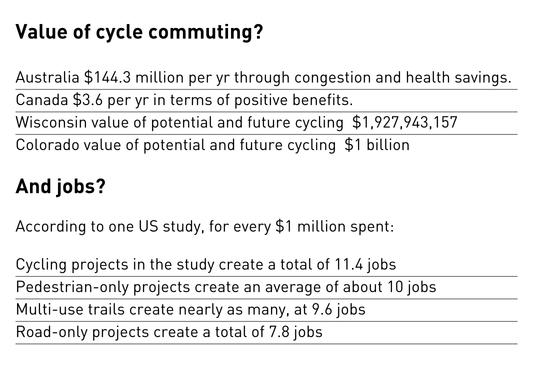
In Australia commuter cycling has been assessed as being worth $144.3 million per year through congestion and health savings. [13] In Canada active transport has been estimated at being worth $3.6 billion dollars per year in terms of positive benefits. [14] In the USA the states of Wisconsin and Colorado have valued potential and future cycling at $1,927,943,157 [15] and $1 billion respectively.
The actual business of building the infrastructure for cycling has a positive impact too when compared with standard road-building. One study in the United States reviewing 58 separate projects found that overall cycling infrastructure creates the most jobs for a given level of spending.
For every $1 million spent, the cycling projects in the study create a total of 11.4 jobs within the state where the project is located. Pedestrian-only projects create an average of about 10 jobs per $1 million and multi-use trails create nearly as many, at 9.6 jobs per $1 million. Infrastructure that combines road construction with pedestrian and bicycle facilities creates slightly fewer jobs for the same amount of spending, and road-only projects create the least, with a total of 7.8 jobs per $1 million.
Once infrastructure is in place it’s common sense that upkeep is simpler and more affordable when it comes to cycle lanes. Twenty tonne buses and lorries just rip up on-road cycling lanes. Even the heaviest cyclist (preferably sans Lycra) will do virtually no damage to a cycle route.
According to Manchester Council estimations [16] the resurfacing of a road (for example 500m long and 7m wide) costs are as follows: to resurface a road (remove and replace the top layers) £68,000; to reconstruct a road (replace the structural layers) £108,000; and to microasphalt a road (reseal the surface layers) £19,000.
Building cycleways is a critical step to getting more people onto bikes, particularly as women and older groups feel more safe in dedicated, segregated cycleways; the good news is that those cycleways are also a great economic boost to the city, too.
Creating urban space
Another no-brainer for working out the economics of cycling is the fact that cities can feel a longer term benefit as people switch to active travel and they can start to convert space allocated to parking spaces to more productive forms of urban land use.
According to one report from the Netherlands, the construction costs of a parking space for a bicycle amount to approximately 5% of the cost of a parking space for a car
According to one report from the Netherlands, the construction costs of a parking space for a bicycle amount to approximately 5% of the cost of a parking space for a car (depending greatly on the quality of the facilities). The cost ratio is 1:20 comparing a parking bay on a street to a space in a bicycle rack, but this ratio still stands when a (multi-storey) car park for cars is compared with a covered bicycle parking facility.
Real estate costs make a major difference in terms of costings. In Amsterdam, it was calculated that construction of a (multi-storey) car park in the pre-war districts would cost over US$ 15,000 per car, and a parking space for a car under a canal house in the centre costs US$ 50,000. [17]
In the UK studies have shown that car parking, particularly subsidised, has a major impact on travel choices and that it weighs heavily on the budgets of both businesses and local authorities in terms of infrastructure (even though there will be an income stream through on-street bays). Also commuters are very reluctant to pay for parking, with one survey showing that nearly half of people would not be prepared to pay anything to park at work, and 36% would only be prepared to pay £1-2 per day. [18]
Keeping down the costs of travel
The RAC puts the cost of owning and running a car, on average, at £6,689 compared to an estimated £0-£200 for keeping a bicycle on the road; fuel, repair and maintenance all adds up. Similarly there are clear-up costs for cars that can be factored into the economics of cycling at a city scale, too.
One obvious area of saving is dealing with fewer accidents. A study in Australia looking at the benefits of cycling in terms of road trauma estimated that accidents currently cost a massive $17 billion per year. [19]
There are also pollution costs to consider. Air pollution causes annual health costs of roughly £15 billion to UK citizens. This is comparable to the growing annual health costs of obesity, estimated at £10 billion. Road-based, fossil-fuel based transport has a significant part to play in those costs.
Water pollution can also be linked to car use with external costs including water damage from road salt, and leakage of oil, antifreeze, or other hazardous fluids. There are also flood risk problems through increased impervious surfaces due to paving of roads and car parks..
And while some debate continues about the precise value that can be attached to carbon emissions, Greater Manchester does have a 48% carbon reduction target in place that will have an economic cost to deliver, which will be offset by increases in cycling.
Cities in Colombia, Germany, Spain and the UK have all estimated significant CO2 reductions through their cycling investments and in the case of Bogotá, Colombia — a city with a current bicycle modal share of 3.3% on a total of 10 million daily trips — results in a climate value of cycling of 55,115 tons of CO2 per year, corresponding to an economic value of between 1 and 7 million US dollars when traded on the carbon market. [20]
Bike tourism and the buying of ‘stuff’
Beyond health, infrastructure and reduced costs of congestion there’s a positive economic impact from tourism, bike sales and increased retail that can be tracked as cycling increases.
Various tourist boards have tracked the economic impact of dedicated biking trails. In Australia the ‘Rail Trails’ have shown that for every visitor day at the Rail Trails, $51.10 of expenditure is injected into the economy. In the UK an estimate of the impact on Welsh biking trails tracked an economic impact the element generated by tourists of £8.3 million per annum on the Celtic Trail and £1.6 million on the Taff Trail.
In the USA the return on investment in North Carolina from NCDOT and the local municipalities to construct the dedicated bicycle facilities in the northern Outer Banks was assessed and the estimated $6.7 million expenditure of public funds over a ten year period was shown to yield a return each year that is approximately nine times the initial investment. If the additional $2 million spent on bicycle improvements built as part of a highway or bridge project is added, the return on the investment is still very high with a sevenfold return each year.
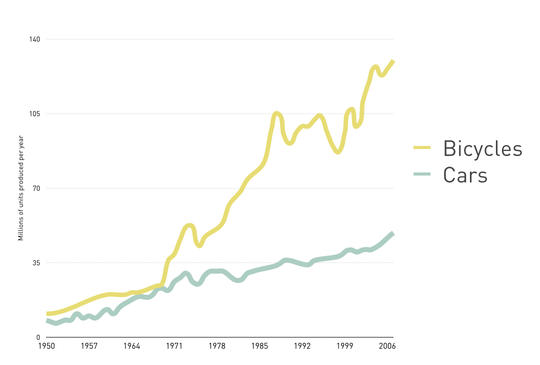
The chart below from the Earth Policy Institute shows the growth curves for the manufacturing of both cars and bikes: in spite of a huge global adspend for the car industry there are clearly plenty of people still buying bikes and this too plays out in terms of local economic impacts.
And while bike shops will benefit from an increase in cycling, generally retail has been shown to benefit in cycle or walking-friendly areas.
One US study with results across a range of establishment types show that customers who arrive by car spend more on average per trip than others, but taking the frequency of visits into account, however, reveals a different result — cyclists are greater spenders on average.
In another US study of twenty-seven retailers located in the Mission District of San Francisco an analysis was made of how the Valencia Street bicycle lanes have impacted businesses. Four and a half years after the bike lanes were built, the vast majority of the interviewees expressed support for the bike lanes. Sixty-six percent of the merchants believe that the bike lanes have had a generally positive impact on their business and/or sales, and the same percentage would support more traffic calming on Valencia Street.
Thirty-seven percent of merchants reported that the bike lanes have increased their sales. Seventy-three percent thought that the bike lanes have made the street more attractive.
Weirdly, some merchants reported that increased congestion (41%) and reduced auto speed (46%) were good conditions for business but on eleven of the nineteen variables, not one merchant reported that the bike lanes had made conditions “worse”.
Critically this last point, that segregated cycle lanes in particular can give local businesses a boost, should be factored into Greater Manchester communications around the roll-out of a series of segregated and continuous cycleways to be developed through Vélocity 2025. There is a hard-to-shift presumption on the part of some that a raft of car-parking places immediately outside a storefront or restaurant is the civic design equivalent of getting ‘By Royal Appointment’ plastered over your product; a shortcut to certain success.
The reality is that cycling provision has been proven to be a better underpinning of retail or leisure business.
Our Gross Cycling Product
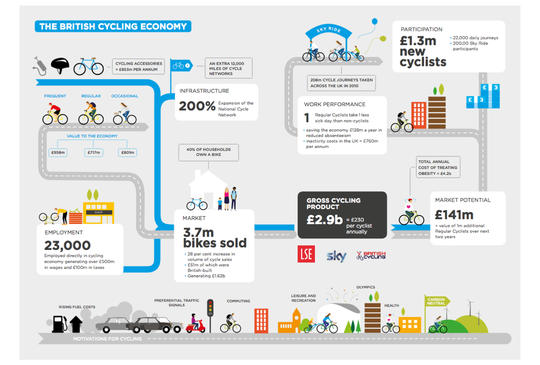
The chart above is a summary of the pioneering report published by the London School of Economics, SKY and British Cycling into the ‘Gross Cycling Product’ for Britain returned through infrastructure, employment, retail sales, and business performance. Some of the economic returns outlined in this briefing were not covered in the LSE report but, broadly speaking, it placed the annual contribution of cycling to UK PLC as being around £2.9 billion per year, or £230 per cyclist.
If Greater Manchester succeeds in ‘doubling and doubling again’ its cycling levels to around 100,000 regular cyclists by that methodology our ‘Gross Cycling Product’ would stand at around £23 million per year. This represents, by mode, possibly one of the swiftest returns on investment possible through city-wide investment in transport infrastructure.
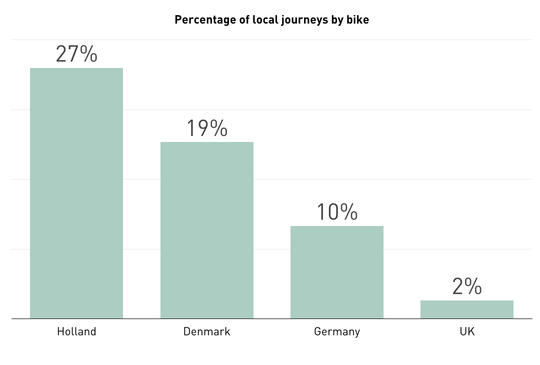
The economic case for cycling is strong but we have a very significant journey ahead of us compared to other European cities. As the chart above shows we are a significant distance behind our neighbours when it comes to the share of journeys taken by bike. In those countries famed for cycling (Netherlands, Denmark) every fourth or fifth journey is by bike but in Germany and Spain the levels are increasing, too. We have ground to make up.
And with other EU cities in view, one last case for transforming into a cycle city is worth making; what cycling can do to our city brand. If you were to concoct a recipe for becoming known as a sophisticated, stylish and contemporary conurbation, cycle chic is one of the key ingredients that you’d hurl in alongside coffee shops, a bohemian quarter, an arts festival or two, a decent market and something designed by Zara Hadid.
Cycling, as H.G. Wells argued so many years ago, signals a civil society and level of human progress that in his view nudged towards Utopia. In the 21st Century you could argue it is simply part of being an original and modern city.
The facts outlined above are clear. If we make a generational shift in levels of cycling through high quality urban interventions and a shift in transportation culture, we have the potential to repay that investment quickly and dramatically through better health, better business and a transformed city environment.
It’s better by bike.
Acknowledgments and declaration of interests
Steve Connor assisted TfGM with the writing of Velocity 2025 and Creative Concern works with a number of cycling organisations or campaigns including Love Your Bike, Brompton Bike Hire, Sustrans and BikeRight.
With thanks to Pete Abel of Love Your Bike for extensive input into the research behind this article, and to Transport for Greater Manchester who commissioned a significant amount of the research, also, to help inform the recently published GM Cycling Strategy.
End Notes
- Hamer,M; Chida,Y (2008) Active commuting and cardiovascular risk: A meta-analytic review. Preventive Medicine, v46, pp9-13
- Blake,H; Lloyd,S (2008) Influencing organisational change in the NHS: lessons learned from workplace wellness initiatives in practice. Quality in Primary Care, v16, n6, pp449-455. (Page 453)
- Cycling in London (2008). Prepared for: Transport for London. Prepared by: Steer Davies Gleave
- Bauman,A; Rissel,C; Garrard,J; Ker,I; Speidel,R; Fishman,E (2008) Cycling: getting Australia moving - barriers, facilitators and interventions to get more Australians physically active through cycling. (Page 151) http://www.atrf.info/papers/2008/2008_Bauman_Rissel_Garrard_Ker_Spiedel_...
- Bauman,A; Rissel,C; Garrard,J; Ker,I; Speidel,R; Fishman,E (2008) Cycling: getting Australia moving - barriers, facilitators and interventions to get more Australians physically active through cycling. (Page 151) http://www.atrf.info/papers/2008/2008_Bauman_Rissel_Garrard_Ker_Spiedel_...
- Lindsay,G; Macmillan,A; Woodward,A (2011) Moving urban trips from cars to bicycles: impact on health and emissions, Australian and New Zealand Journal of Public Health, v35, no.1 pp54-60
- Grabow,ML; Spak,SN; Holloway,T; Stone,JB; Mednick,AC; Patz,JA (2011) Air quality and exercise-related health benefits from reduced car travel in the midwestern United States. Environmental Health Perspectives, v120, pp68-76. http://www.ncbi.nlm.nih.gov/pmc/articles/PMC3261937/pdf/ehp.1103440.pdf
- Hansson,E; Mattison,K; Bjork,J; ᅱstergren,P-O; Jakobsson,K (2011) Relationship between commuting and health outcomes in a cross-sectional population survey in southern Sweden. BMC Public Health,
- Clifton,KJ; Morrissey,S; Ritter,C (2012) Exploring the Relationship Between Consumer Behaviour and Mode Choice, TR News, May-June, pp29-32. http://onlinepubs.trb.org/onlinepubs/trnews/trnews280.pdf#page=31
- 10km x 5 (days) x 47 (weeks) x 25,759 = 60,557,000 kilometres per year
- 10km x 5 (days) x 47 (weeks) x 75,000 = 176,250,000 kilometres per year
- Cavill N, Kahlmeier S, Rutter H, Racioppi F, Oja P. Economic analyses of transport infrastructure and policies including health effects related to cycling and walking: a systematic review. Transport Policy 2008;15:291-304. www.euro.who.int/__data/assets/pdf_file/0010/53857/E92660.pdf
- Bauman,A; Rissel,C; Garrard,J; Ker,I; Speidel,R; Fishman,E (2008) Cycling: getting Australia moving - barriers, facilitators and interventions to get more Australians physically active through cycling. (Page 151) http://www.atrf.info/papers/2008/2008_Bauman_Rissel_Garrard_Ker_Spiedel_...
- Campbell, R and Wittgens,M (2004) “The Business Case for Active Transportation : The Economic Benefits of Walking and Cycling”, http://thirdwavecycling.com/pdfs/at_business_case.pdf
- Grabow,ML; Hahn,M; White,M (2010) Valuing Bicycling's Economic and Health Impacts in Wisconsin. http://www.sage.wisc.edu/igert/download/bicycling_final_report.pdf
- Manchester City Council : Update on the report of the Highway Maintenance Working Group. Report to Neighbourhoods Scrutiny Committee 3rd September 2013.
- Buis,J; Wittink,R (2000) The Economic Significance of Cycling : A study to illustrate the costs and benefits of cycling policy. Page 17 http://www.ocs.polito.it/biblioteca/mobilita/EconomicSignificance.pdf
- (2008) Motoring Towards 2050: Parking in Transport Policy : Parking Factfile.
- Bauman,A; Rissel,C; Garrard,J; Ker,I; Speidel,R; Fishman,E (2008) Cycling: getting Australia moving - barriers, facilitators and interventions to get more Australians physically active through cycling. http://www.atrf.info/papers/2008/2008_Bauman_Rissel_Garrard_Ker_Spiedel_...
- Massink,R; Zuidgeest,M; Rijnsburger,J; Sarmiento,OL; Van Maarseveen,M (2011) The Climate Value of Cycling. Natural Resources Forum, v35, n2, pp100-111.
Recommended Articles:

Vélocity victory: £20 million to support cycling in Greater Manchester
on 15.08.2013
Contributed by Rachel Whelan
Contributed by Rachel Whelan


Why we should all campaign for safe cycle routes to schools
on 23.07.2014
Contributed by Melissa Henry
Contributed by Melissa Henry
Share this: 


Contributor Profile

Co-Founder and CEO, Creative Concern
Steve is co-founder and CEO of Creative Concern. He specialises in ethical and sustainability issues, integrated campaigns, city strategies, brand development and creating strange installations out of trees, lights and beautiful type. Particular areas of expertise include climate change, place making, transport, food issues and the natural environment.